How we scoreBlogAdvertise
html›body›main#charts791 models · updated Oct 21, 2026
  1. compoundsemi.com
  2. Charts
  3. Beam distance (ANSI FL1) vs maximum output
Charts

Beam distance (ANSI FL1) vs maximum output

399 models since 2020 on one chart: each dot is a model. The dashed line is the median beam distance (ANSI FL1) for a given maximum output.

Axes run from the 1st to the 99th percentile; extreme values are left off the chart.

Stand-outs
Most beam distance (ANSI FL1) for their maximum output

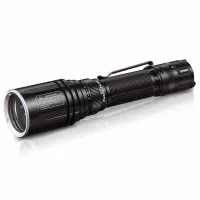
1 Fenix TK30R
Fenix · 2024
TK30R
500 lm1,500 m21700 Li-ion250 g
1,500 m500 lm
6.3
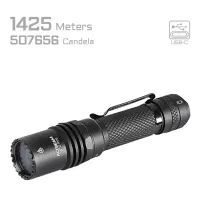
2 Acebeam W10 Pro LEP
Acebeam · 2025
W10 Pro LEP
750 lm1,425 m21700 Li-ion
1,425 m750 lm
6.8
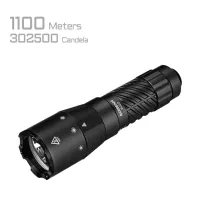
3 Acebeam W20 LEP
Acebeam · 2026
W20 LEP
600 lm1,100 m16340 / RCR123A Li-ion, CR123A131 g
1,100 m600 lm
6.0
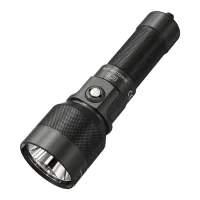
4 Nitecore DL30
Nitecore · 2025
DL30
1,100 lm788 m
788 m1,100 lm
5.9
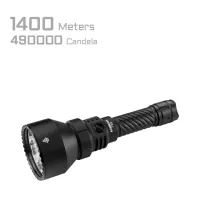
5 Acebeam T29 Ultra
Acebeam · 2026
T29 Ultra
2,900 lm1,400 m21700 Li-ion308 g
1,400 m2,900 lm
9.0
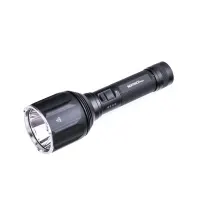
6 Nextorch P82C
Nextorch · 2024
P82C
2,200 lm1,100 m21700 Li-ion281 g
1,100 m2,200 lm
6.5
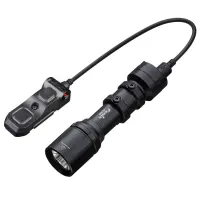
7 Fenix GL30R
Fenix · 2026
GL30R
800 lm630 m18650 Li-ion, CR123A206 g
630 m800 lm
9.3
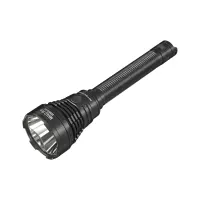
8 Nitecore MH40 Pro
Nitecore · 2024
MH40 Pro
3,500 lm1,300 m21700 Li-ion
1,300 m3,500 lm
7.5
To compare: 0up to 4 models
Compare