How we scoreBlogAdvertise
html›body›main#charts791 models · updated Oct 21, 2026
  1. compoundsemi.com
  2. Charts
  3. Beam distance (ANSI FL1) vs weight
Charts

Beam distance (ANSI FL1) vs weight

275 models since 2020 on one chart: each dot is a model. The dashed line is the median beam distance (ANSI FL1) for a given weight.

Axes run from the 1st to the 99th percentile; extreme values are left off the chart.

Stand-outs
Most beam distance (ANSI FL1) for their weight

1 Acebeam W20 LEP
Acebeam · 2026
W20 LEP
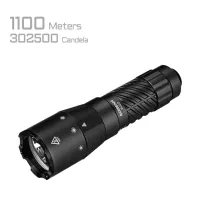
600 lm1,100 m16340 / RCR123A Li-ion, CR123A131 g
1,100 m131 g
6.0
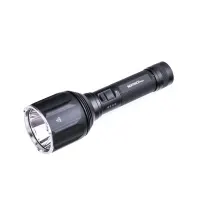
2 Nextorch P82C
Nextorch · 2024
P82C
2,200 lm1,100 m21700 Li-ion281 g
1,100 m281 g
6.5
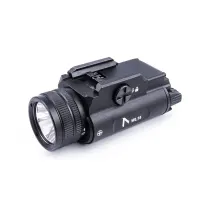
3 Nextorch NEXDOT WL15
Nextorch · 2025
NEXDOT WL15
1,200 lm420 m16340 / RCR123A Li-ion, CR123A73 g
420 m73 g
9.0
4 Nitecore NPL27
Nitecore · 2025
NPL27
650 lm410 m73 g
410 m73 g
6.0
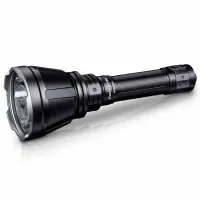
5 Fenix HT18R
Fenix · 2023
HT18R
2,800 lm1,100 m21700 Li-ion326 g
1,100 m326 g
7.4
6 Acebeam P20 Mini
Acebeam · 2026
P20 Mini
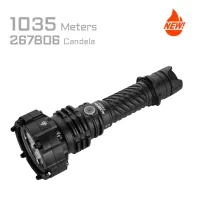
4,000 lm1,035 m21700 Li-ion306 g
1,035 m306 g
9.5
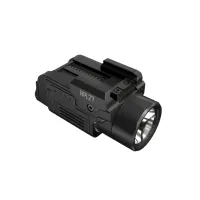
7 Nextorch NEXDOT WL25
Nextorch · 2025
NEXDOT WL25
1,200 lm420 m16340 / RCR123A Li-ion, CR123A90 g
420 m90 g
9.6
8 Fenix HT18R V2.0
Fenix · 2025
HT18R V2.0
3,700 lm1,100 m21700 Li-ion358 g
1,100 m358 g
8.8
To compare: 0up to 4 models
Compare